Generative AI declaration: The making of this work involved sustained use of generative AI tools, specifically Claude (Anthropic) and Gemini (Google), as CLI-based development agents. In writing about the work, AI assisted with structural feedback, grammar, and clarity. All creative direction, intellectual content, and the final work remain my own.
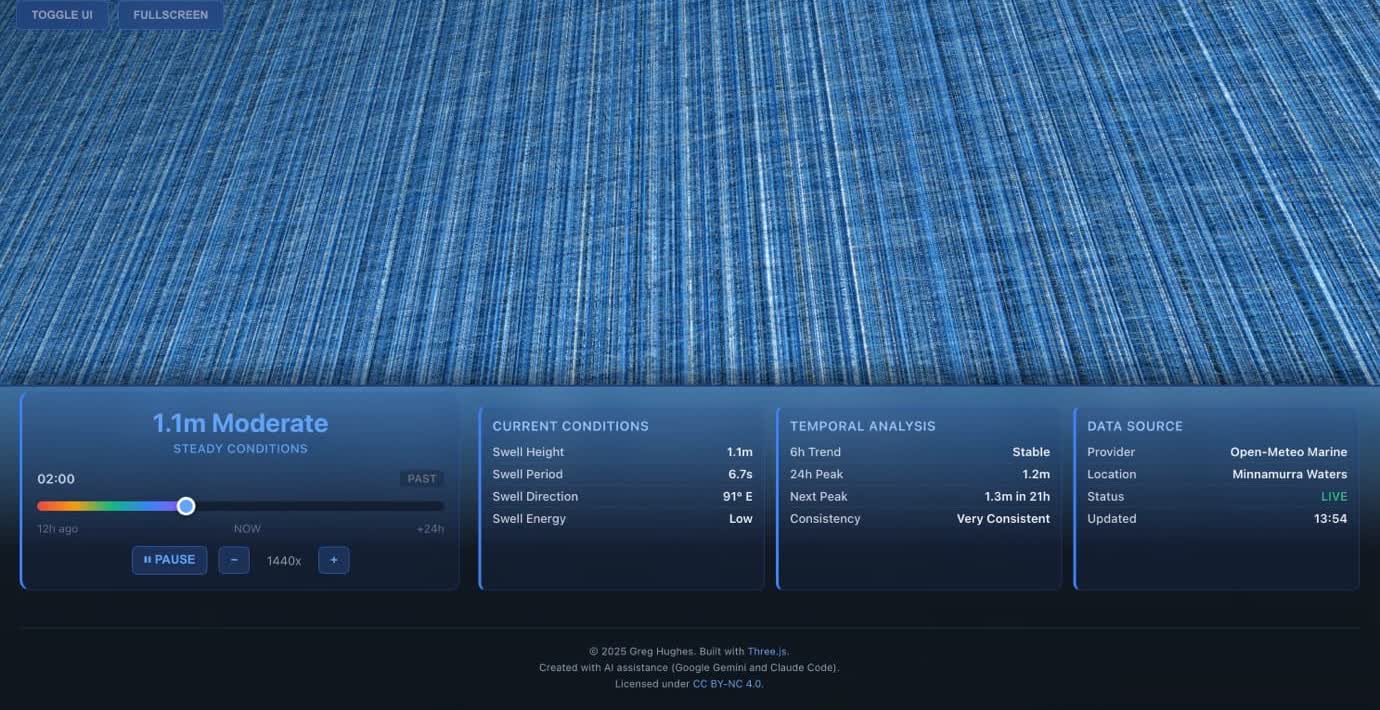
Mystics Mayhem: Cymatic Swell Visualiser 1.0 reimagines real-time ocean data as resonant, moving form. Grounded at Minnamurra Beach (Dharawal Country, on the NSW South Coast), it renders live swell conditions as dynamic 3D vortex patterns, translating wave height, period, direction, and energy into geometric forms that pulse and drift with the sea.
The work draws on cymatics, the study of visible sound and vibration patterns in physical media, as a way of thinking about ocean data: not as numbers on a chart, but as resonant phenomena. Live data is pulled from the Open-Meteo Marine API and rendered through Three.js, a WebGL-based JavaScript library for 3D graphics in the browser, generating up to 80 geometric forms at once, each responding to swell amplitude. Wave height sets the amplitude, period shapes the pulse rhythm, and direction guides spatial emphasis. Post-processing effects such as bloom and anti-aliasing enhance the visual output, and a simulation fallback keeps the piece alive when live data is not available.
An interactive timeline lets you move through past, present (real-time), and forecast swell, so the same stretch of coast can be read backwards and forwards in time. The result is less a dashboard than an instrument: a place-based way of attending to local ocean conditions through pattern, rhythm, and movement.
A coastal ecosystem inquiry
The visualiser began as a technical proof-of-concept: a test of how real-time oceanographic data might be made into something you can feel as much as read. It is deliberately built on accessible web technologies so that it runs in any standard browser, lowering the barrier to engaging with local ocean conditions and treating environmental data as both an aesthetic and a scientific instrument. Part of the experiment was methodological. The piece became a way to test how CLI-based, AI-assisted co-coding can speed up the prototyping of responsive environmental interfaces, and to capture that working process as it happened.
At its heart is a question of translation. How can a dataset of wave height, period, direction, and energy be mapped to geometric pattern generation and particle physics in a way that genuinely suggests ocean dynamics, rather than simply decorating the numbers? Working through that question produced a set of repeatable methods for representing coastal conditions visually, alongside an extensible codebase that could feed future coastal-monitoring interfaces, public art installations, or environmental-education tools. Cymatic pattern generation is tested here as a way of turning scientific data into something intuitive and aesthetically driven, an approach to environmental data literacy that meets people through the senses.
Place and connections
The work is anchored to a specific place, Minnamurra Beach, which opens the possibility of community engagement with local oceanographic conditions rather than abstract, placeless data. It also sits within a larger body of place-based practice. Where the Mangrove MIDI Platform listens in on estuarine and littoral systems, the Cymatic Swell Visualiser pushes offshore. Together they sketch a spectrum of coastal zones, from the mangrove roots to the open swell, extending a single inquiry from nearshore ecology out into deeper water. Both feed into the ongoing Remediation in the Rhizosphere project, which looks for ways to image invisible ecological processes through digital sound and moving image.
How it was made
The visualiser was developed through CLI-based, AI-assisted co-coding, an iterative process working with Claude and Gemini as development agents inside VS Code's integrated terminal. The approach was conversational: sharing code examples, linking to precedents from JavaScript framework galleries, and feeding browser console errors back into the loop when problem-solving. Reference-based specification, pointing to existing Three.js examples to describe a desired behaviour, was central to shaping the wave motion, refraction, and particle systems. The work evolved across more than twenty HTML iterations between June and November 2025, with wave scale and visual behaviour refined through repeated testing.
Project links
- Live platform: cymaticswell.pages.dev
- Data deposit (Zenodo): doi.org/10.5281/zenodo.19331753
Created 2025.